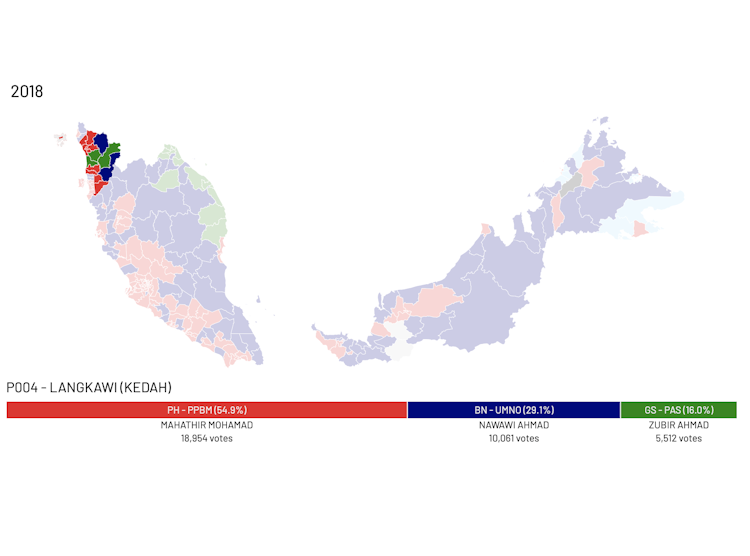
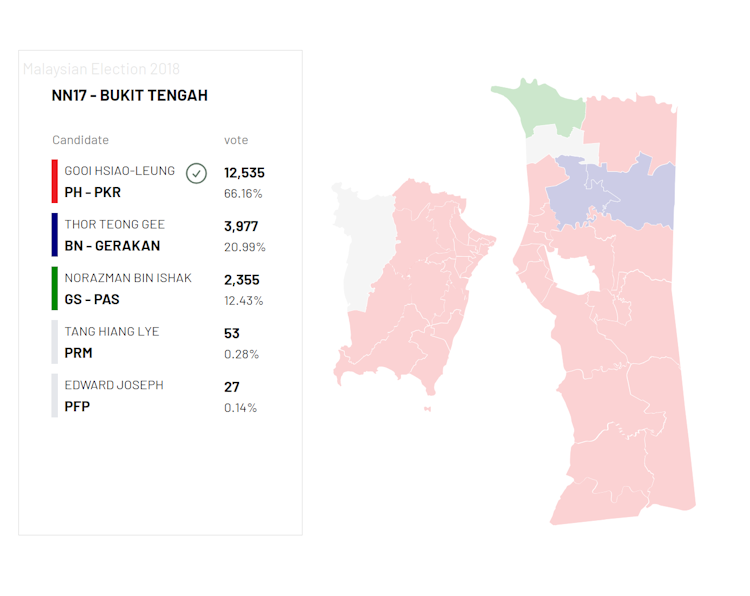
Enhance your election reporting with our ready-to-use data vizzes.
Filter
Choose the dataset you would like to show. Pick the year range, district, and other variables that fit your analysis.
Customize
Customize the display of your viz. Choose the color, screen size, and language that speak to your audiences.
Publish
Retrieve the link to your customized viz, embed it into your article, or download your own copy as an image or PDF.
We are working on updating the data and improving the vizzes.
Subscribe to our mailing list to stay updated!
Select Template
Choose to show election results, party performance or a candidate profile.


